Most organizations start their annual report too late. The photography is not ready, the program data has not been compiled, the executive director’s message keeps getting pushed to next week, and suddenly a document that should take six weeks to design is being rushed in three. The result tends to show: thin content, rushed layouts, and a report that no one is particularly proud of.
Planning an annual report well is not complicated, but it does require treating it as a strategic project from the beginning rather than a production task that gets handed to a designer at the end. Here is how to approach the process so that the report you produce reflects the quality of your organization’s work.
Start with the Narrative, Not the Data
The most common mistake in annual report planning is starting with the numbers. Financial summaries, program statistics, and outcome metrics are important, but they are not the story – they are the evidence that supports the story. Before you compile data or brief a designer, answer one question: what is the central message of this year’s report?
That message might be growth: membership increased, programs expanded, or a capital campaign closed. It might be resilience: your organization navigated a difficult year and emerged with programs intact. It might be impact: a specific initiative produced measurable outcomes that your funders care about. Whatever it is, every section of the report – every chart, every photograph, every pull quote – should reinforce that central message rather than compete with it.
Identify the message before anything else. It will make every decision that follows easier and more coherent.
Build a Content Inventory Early
Annual reports fail in production more often than in design. The most common cause is missing content: photography that was never commissioned, data that requires three approval cycles to release, impact stories that no one has written down, financial information that the auditor will not finalize until two weeks before your deadline.
A content inventory, completed early in the process, prevents all of this. Go section by section through the report structure and identify what content each section requires, who owns it, what its current status is, and when it will be ready. That inventory becomes the project management document for the entire engagement.
Do this six to eight weeks before your target delivery date. That gives you time to commission photography, chase down missing data, and write program narratives before the design process begins rather than during it.
Invest in Photography
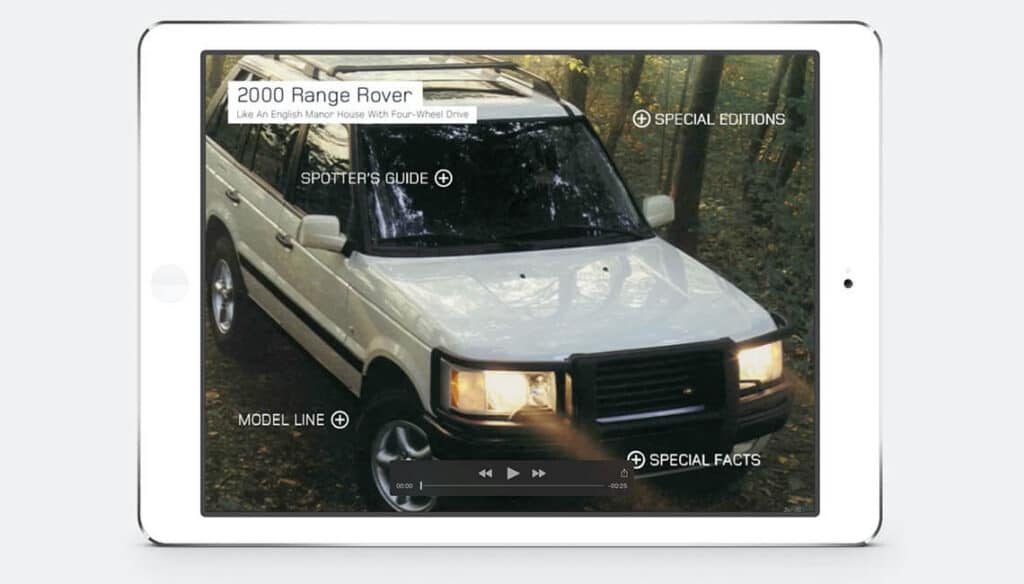
Photography is consistently the most powerful element in an annual report and the most frequently underinvested. Organizations that commission professional photography for their report consistently produce stronger documents than those relying on staff-taken candids or stock imagery.
Good annual report photography does two things: it shows real people in real program contexts, and it gives the designer material that can carry full-page spreads, section openers, and pull-out quotes. That requires planning – identifying the programs and people to photograph, scheduling shoots, and briefing the photographer on the narrative the images need to support.
If budget constrains commissioned photography, audit your existing image library honestly. Select the strongest 20 percent and plan the report around those. A well-designed report with fewer strong images beats a report stuffed with weak ones.
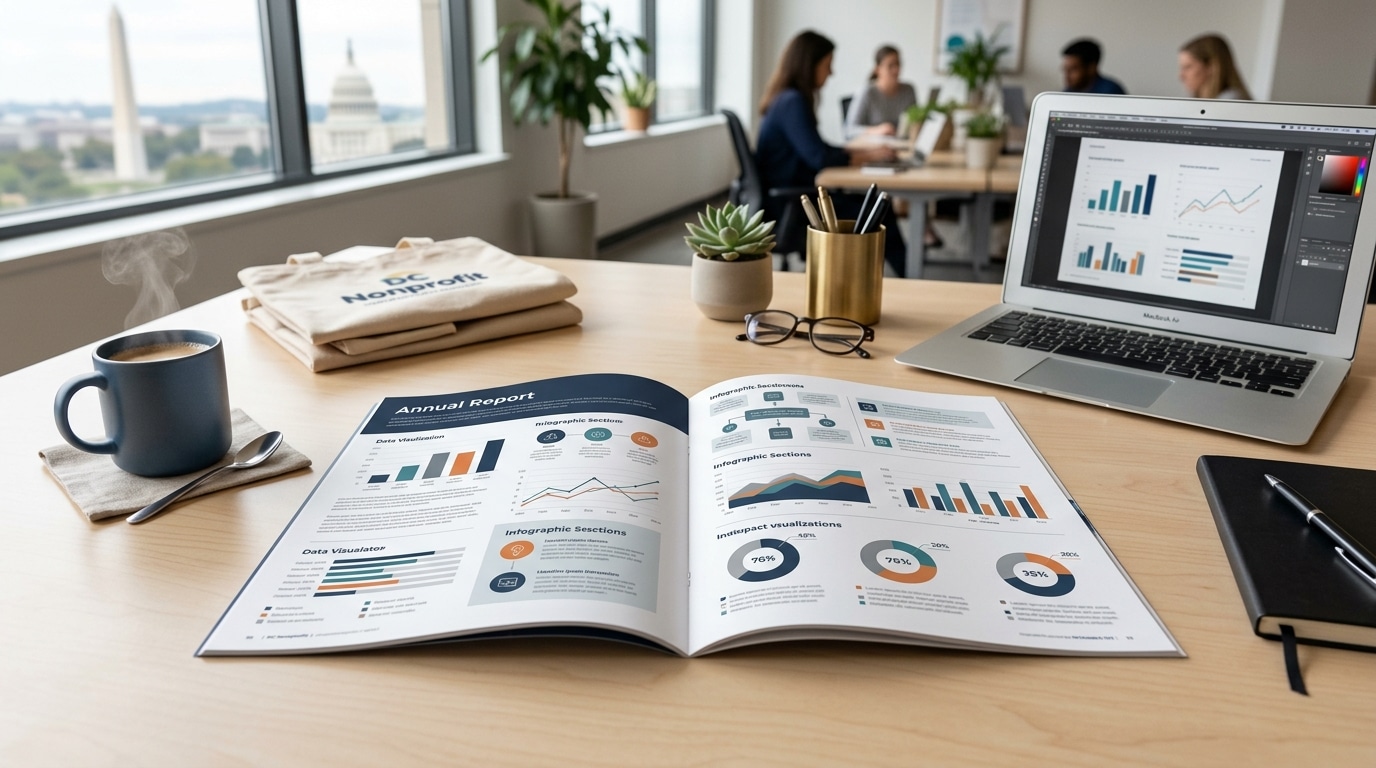
Choose the Right Data to Visualize
Not all data belongs in an annual report, and not all data that belongs in an annual report should be visualized. The decision about what to show as a chart or infographic should be driven by what the data communicates to your reader, not by what your organization has available.
Data visualization works best when it makes a comparison, shows a trend, or communicates scale that would be hard to grasp from a number alone. A fundraising total that grew 40 percent year-over-year is a strong visualization candidate. A breakdown of administrative versus program expenditures may matter to your board but be irrelevant to donors. Know your audience for each data point before you decide how to present it.
The best annual report designers will help you make these decisions. If your design team is asking you to hand over spreadsheets and waiting for instructions, that is a sign they are not fully engaged with the strategic side of the project.
Plan for Multiple Formats from the Start
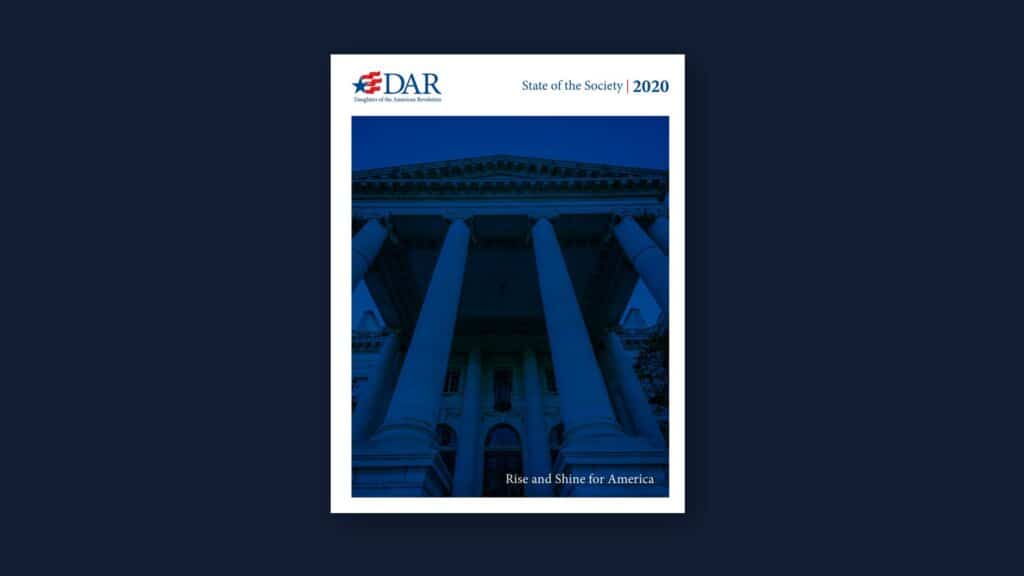
Most annual reports are produced in at least two formats: a print version for major donors and board members, and a digital PDF for broad distribution. Many organizations now produce a web-based version as well, either as a standalone microsite or as a series of web pages with embedded data visualizations.
The mistake is designing for one format and adapting to the others at the end. Print and digital have different design requirements: typography that reads beautifully in a printed document may not be legible as a PDF on a phone, and interactive data visualizations that work well on a web page require a completely different approach than static infographics.
Brief your design team on all formats at the start of the project, and make sure the production scope includes optimization for each. A print-ready PDF adapted for digital will always underperform a document designed with both in mind from the beginning.
Set a Realistic Timeline
A well-produced annual report takes six to ten weeks from full content delivery to final files. That timeline assumes content arrives complete, feedback cycles are consolidated, and approvals happen within the agreed timeframe. Each of those assumptions requires active management.
Work backward from your target delivery date to build a production schedule: content due date, first design concepts, first full draft review, revision round, and final approval. Assign owners to each milestone and communicate the consequences of delays – a two-week slip in content delivery compresses everything that follows.
If your organization has a fixed event where the report will be distributed – an annual gala, a board meeting, a conference – that date is non-negotiable. The timeline works backward from there, not forward from whenever content is ready.
Working with an Annual Report Design Agency
The process described above is straightforward, but executing it well while running an organization’s day-to-day programs is genuinely difficult. An experienced annual report design agency brings project management, editorial judgment, and production expertise that makes the process faster and the outcome stronger.
The right design partner does not just wait for instructions – they help you identify the narrative, structure the content, make photography decisions, and manage the production schedule so that your internal team can focus on the approval and content decisions that require organizational expertise rather than design expertise.
If your organization is starting to think about this year’s annual report, Sutter Group can help you plan and produce a document that reflects the quality of your work. Start a conversation with our team.